
최근 React로 프로젝트를 하고 있는데 API를 활용해서 그래프를 구현하기로 했다.
그래서 가장 유명한 차트 라이브러리인 Chart.js를 선정했다.
근데 어떻게 쓰는거지?
1. 설치하기
React에서 chart.js를 사용하려면 chart.js뿐만 아니라 react-chartjs-2도 설치를 해줘야한다.
npm install react-chartjs-2 chart.js2. 예시 가져오기
설치가 완료되었으면, react-chartjs-2 공식 사이트에서 제공하는 차트 컴포넌트를 사용하면되는데,
문제는 지금 사이트가 터졌는지 들어가지지가 않는다.

그래서 나는 그냥 구글링해서 다른 분들이 올려준 코드를 긁어서 썼다.
✅ Bar Chart(.tsx)
import {
  Chart as ChartJS,
  CategoryScale,
  LinearScale,
  BarElement,
  Title,
  Tooltip,
  Legend,
} from "chart.js";
import { Bar } from "react-chartjs-2";
import { ChartOptions } from 'chart.js';

ChartJS.register(
  CategoryScale,
  LinearScale,
  BarElement,
  Title,
  Tooltip,
  Legend
);

export default function Chart() {
    const options: ChartOptions<'bar'> = {
      responsive: true,
      plugins: {
        legend: {
          position: "top" as const,
        },
        title: {
          display: true,
          text: "Chart.js / react-chartjs-2 시작하기",
        },
      },
    };

    const labels = ["January", "February", "March", "April", "May", "June", "July"];

    const data = {
      labels,
      datasets: [
        {
          label: "Dataset 1",
          data: [100, 200, 30, 20, 100, 33, 57],
          backgroundColor: "rgba(255, 99, 132, 0.5)",
        },
        {
          label: "Dataset 2",
          data: [80, 100, 130, 250, 90, 133, 157],
          backgroundColor: "rgba(53, 162, 235, 0.5)",
        },
      ],
    };

    return <Bar options={options} data={data} />;
};
✅ Doughut Chart(.tsx)
import { Chart as ChartJS, ArcElement, Tooltip, Legend } from 'chart.js';
import { Doughnut } from 'react-chartjs-2';
import { ChartOptions } from 'chart.js';

ChartJS.register(ArcElement, Tooltip, Legend);

export default function Chart() {
    const options: ChartOptions<'doughnut'> = {
        responsive: true,
        plugins: {
            legend: {
              position: "top" as const,
            },
            title: {
              display: true,
              text: "Chart.js / react-chartjs-2 시작하기",
            },
      	},
    };
    const data = {
        labels: ['Red', 'Blue', 'Yellow'],
        datasets: [
            {
                label: 'test',
                data: [12, 19, 3],
                backgroundColor: ['rgba(255, 99, 132)', 'rgba(54, 162, 235)', 'rgba(255, 206, 86)'],
                borderWidth: 1,
            },
        ],
    };

    return <Doughnut data={data} options={options} />
}
3. 타입 설정
import { ChartOptions } from 'chart.jsconst options: ChartOptions<'bar'> = {
responsive: true,
plugins: {
legend: {
position: "top" as const,
},
title: {
display: true,
text: "Chart.js / react-chartjs-2 시작하기",
},
},
};
ChartOptions는 Chart.js에서 차트의 옵션을 정의하는 데 사용되는 TypeScript 인터페이스로 import해서 사용하면 된다.
제네릭타입이라 bar, pie, doughnut.. 등 사용하고자 하는 차트의 타입을 적어준다.
4. options 커스텀하기
✅ Bar Chart
const options: ChartOptions<'bar'> = {
        responsive: true, //반응형
        scales: {
            x: {
                grid: {
                    drawOnChartArea: false, // x축 그리드 선 제거
                },
            },
            y: {
                grid: {
                    drawOnChartArea: false, // y축 그리드 선 제거
                },
            },
        },
        indexAxis: 'y', //차트 방향
        plugins: {
            legend: {
                display: false, //범례 안 보이게 하기
            },
            title: {
                display: false, //타이틀 안 보이게 하기
            },
        },
    };
바의 굵기를 조절하고싶으면 data에서 barPercentage를 추가해서 수정해주면 된다.
const data = {
        labels,
        datasets: [
            {
                label: '분류 1',
                data: [1, 2, 3, 4, 5, 6, 7],
                backgroundColor: 'rgba(255, 99, 132)',
                barPercentage: 0.8, //굵기 조절
            },
        ],
    };
✅ Doughut Chart
const options: ChartOptions<'doughnut'> = {
        responsive: true,
        cutout: '80%', // 도넛 차트 굵기 조절
        plugins: {
        legend: {
            display: false,
        },
        title: {
            display: false,
        },
    },
};
5. 반응형
chart.js에는 자체적인 반응형이 있긴 한데, 문제가 있다.
[ChartJS / react-chartjs-2] 완벽한 반응형 차트를 구현해보자#2
responsive:false 로 하고 직접 반응형을 줘보기
velog.io
위에 벨로그에 들어가보면 자세하게 알 수 있다.
화면이 줄여질 땐 같이 줄어드는데 다시 화면을 넓히면 사이즈가 돌아오지않는 이상한 문제점이랄까..
그래서 나는 styled-component를 사용해서 해결을 하였다.
우선 각 차트 컴포넌트를
return (
    <>
        <ChartContainer>
            <Doughnut data={data} options={options} />
        </ChartContainer>
    </>
);
const ChartContainer = styled.div`
display: flex;
justify-content: center;
align-items: center;
width: 100%;
height: 300px; // 원하는 높이로 조정
@media (max-width: 768px) {
height: 200px; // 모바일에서의 높이
}
`;
ChartContainer로 감싸준다.
그리고 차트 컴포넌트를 사용하는 페이지에도 styled-components 처리를 해준다.
<ChartArea>
    <ChartWrapper>
        <DoughnutChart />
        <ChartTitle>시군별 유기동물 수</ChartTitle>
    </ChartWrapper>
    <ChartWrapper>
        <BarChart />
        <ChartTitle>유기동물 상태</ChartTitle>
    </ChartWrapper>
</ChartArea>
const ChartArea = styled.div`
    margin-top: 5rem;
    margin-bottom: 8rem;
    display: flex;
    flex-wrap: wrap; // 자동으로 다음 줄로
    gap: 20px;
    @media (max-width: 768px) {
        flex-direction: column;
        gap: 80px;
        margin-bottom: 5rem;
    }
`;

const ChartWrapper = styled.div`
    flex: 1;
    min-width: 300px;
    text-align: center;
    @media (max-width: 768px) {
        width: 100%;
    }
`;
6. 결과
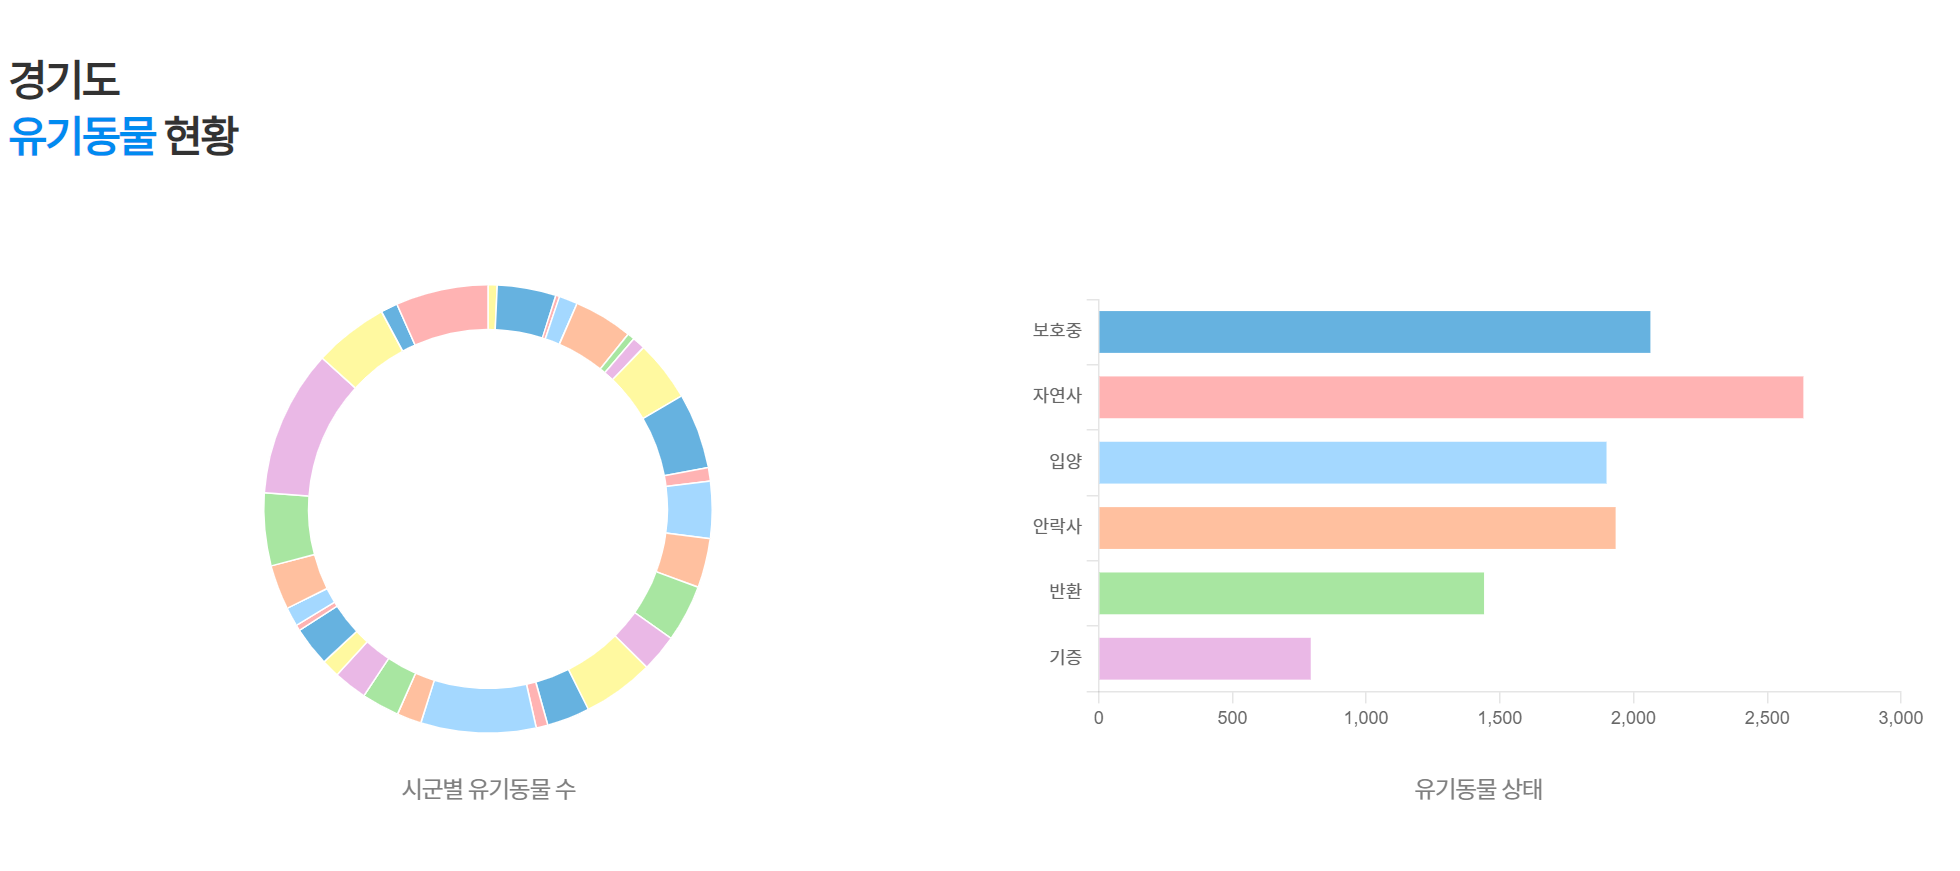
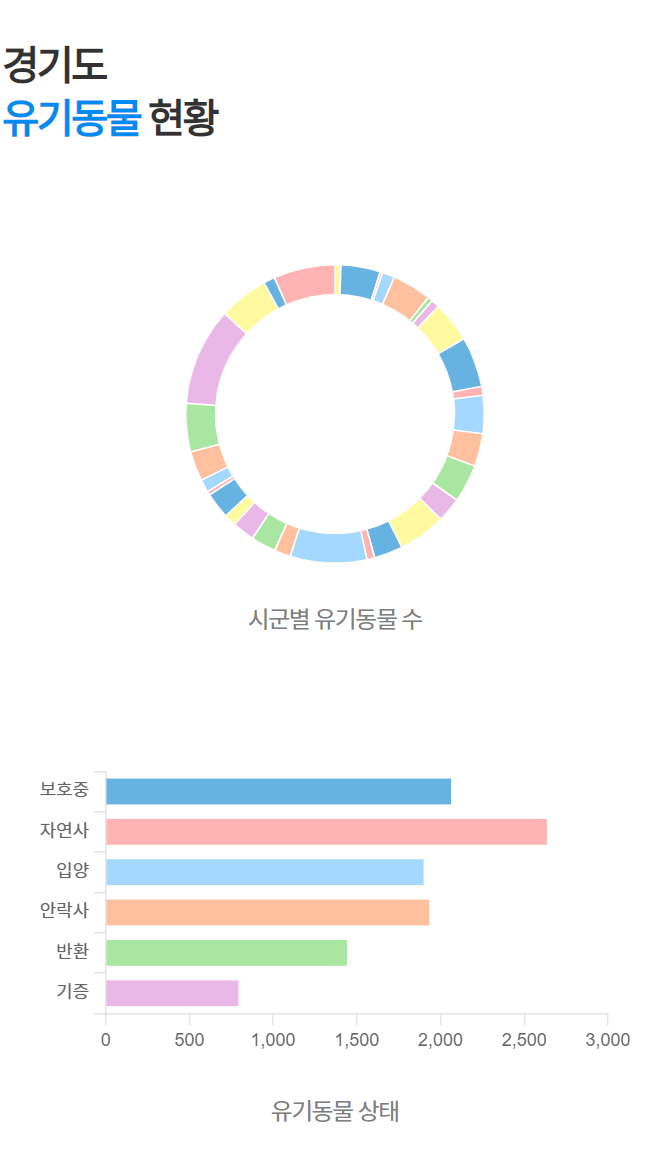
잘 나타나는 걸 볼 수 있다!

'⚡️etc.' 카테고리의 다른 글
| 👋두잇투게더만의 온라인 협업을 위한 컨벤션을 정리해보자(Git, Code, 폴더 구조 및 네이밍) (2) | 2024.12.19 |
|---|---|
| 우리 프로젝트에 제대로 된 Git 브랜치 전략을 세우는 게 어때요? (3) | 2024.11.24 |
| [GitHub Pages] gh-pages 라이브러리를 활용하여 배포하기 (0) | 2024.09.02 |
| Axios와 Promise에 대해 알아보자 (0) | 2024.06.19 |
| [JavaScript] var, let, const의 차이에 대해 알아보자(scope, hoisting...) (0) | 2024.06.19 |


